Ease Into Prep with an SAT® Question of the Day
Answer the question below and see how ready you are. We’ll explain the correct answer in detail so you understand the concept.
A little daily practice goes a long way.
Answer the question below and see how ready you are. We’ll explain the correct answer in detail so you understand the concept.
A little daily practice goes a long way.

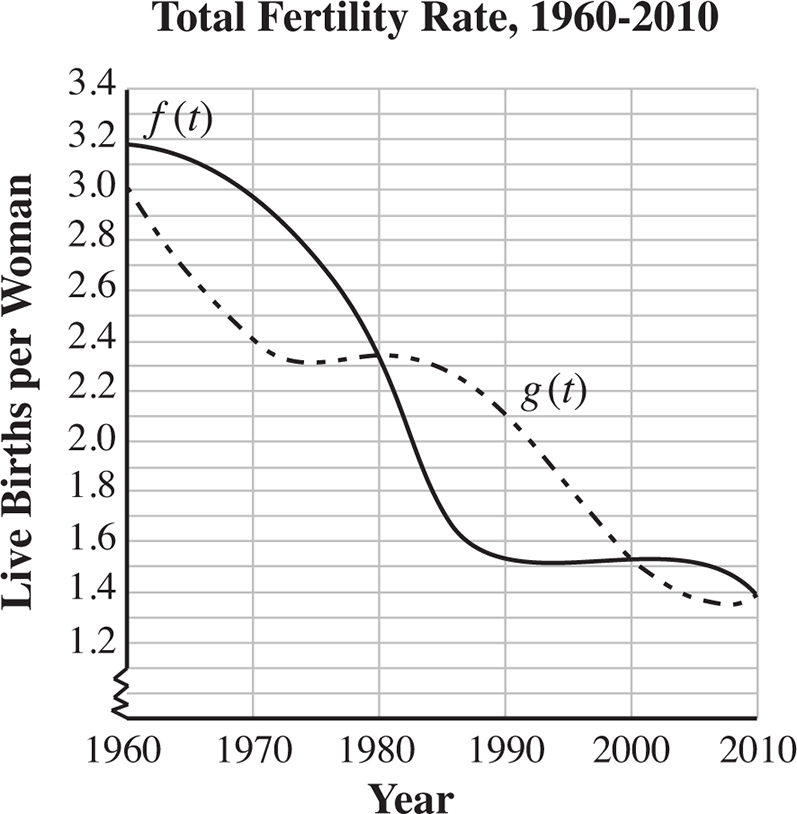
One indicator of a declining economy is a continued decline in birth rates. In 2010, birth rates in Europe were at an all-time low, with the average number of children that a woman has in her lifetime at well below two. In the figure above,f(t) represents birth rates for Portugal between 1960 and 2010, andg(t) represents birth rates in Slovakia for the same time period. For which value(s) oftisf(t) >g(t)?
No matter where you are on your journey, Kaplan's expert teachers can help you raise your score.
Find the course that fits you best.
| Reading & Writing | Math |
|
|